
Raspberry Pi's not-very-documented Watchdog
And a postmortem on my Mastodon instance's outage on 2023-11-23.
It’s been a while! It’s also been a hell of a week for my Mastodon instance, which has had two outages in a span of days:
- An expected, planned outage on Tuesday 21st, from 8am until 11:25am UTC. This isn’t particularly interesting - it was planned.
- Much more interesting is the outage from 3am until ~2pm on Thursday 23rd, which was not expected. Let’s talk about that in the style of a postmortem!
Is a post-mortem even needed?
The short answer? No.
This isn’t a major server that’s powering mission-critical systems that millions of people are using - it’s a tiny server used pretty much exclusively by me, hosting a Mastodon instance (for me and - currently - one other family member), my private Jellyfin instance so I can have the convenience of music and movie streaming but with my own music (I own a good chunk of music that isn’t available on Spotify!), and a couple of Discord bots exclusive to my friends’ servers. All in all, not really that important for anyone who isn’t me or directly affiliated with me in some way - but it does matter to me, and at this point I have similar needs of it as major services demand of their own servers:
- I need it to be somewhat reliable, so it isn’t always offline; and
- I need it to recover on its own if something goes wrong (or at least to be accessible so that I can fix it even while I’m away at university).
(I just don’t need the “scale to infinitely-many users without slowing down” part. Strictly speaking.)
So… It’s at least a good enough excuse for me to write a blog post, and I definitely need more of those. One post a year is enough, right? :P
So, a bit of background
The server in question is a Raspberry Pi 4B 8GB model, which honestly manages requirement 1 fairly well; it used to be a 4GB model, but since I run Mastodon with ElasticSearch enabled, the RAM usage was a little high for my tastes (and I don’t like not having search) - 8GB is plenty for a ~single-user instance, though! With a weekly restart just to ensure that the various background jobs (backup scripts, etc) don’t leave anything behind, this little server has been running with basically no issues for over a year now!
Honestly, Raspberry Pis continue to impress me and make me feel giddy that I can just run my own stuff; it’s such a nice feeling, and I’m not even using them optimally yet (the 4GB Pi could really be used to run the less demanding workloads - like the bots, Grafana, etc…). Yet, somehow, something went wrong on Thursday - why?
Well… technically, the 8GB Pi has run for ~6 months without issues; the 4GB Pi, in the same amount of time, had two instances wherein it “locked up” and became completely inaccessible - over SSH, to ping requests, etc - and thus required a physical restart. It wasn’t really an issue at the time, as it was basically right next to me, but it’s still less than ideal. Typically, this happened while I was actively working on it and maybe pushing it a little hard, so I had initially chalked this down to a RAM availability issue - the 8GB Pi not exhibiting this behaviour only served to reinforce this belief. Until yesterday, when it did the exact same thing.
Only, this time, I’m not right there - I’m at university! Hence, a roughly 11 hour downtime, as I had to wait for a family member back home to restart it for me - not ideal… So, let’s do some post-mortem analysis of what went wrong, and how we might either fix it or mitigate it.
Some graphs
If we look at the CPU usage graph for the period in question, we see some interesting behaviour:
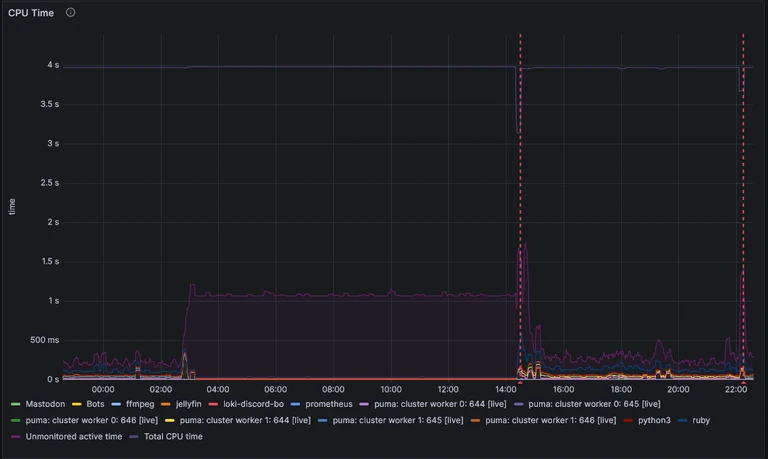

This is my at-a-glance graph, so it doesn’t drill down into what the CPU is doing if it’s not something specifically for Mastodon, my Discord Bots, or Jellyfin, but we can see some things nonetheless:
- The issue started a little before 3am (around 2:45am, if I hover over it), as something that wasn’t being monitored starting ramping up CPU usage.
- During the period of unavailability, 25% of the CPU was being used continuously.
- This is a quad-core CPU, so that would align with about one core being out-of-action.
- This shouldn’t cause a denial-of-service on its own, though, since there are three other cores doing nothing which can pick up the slack!
- Restarting the Pi did fix this, and the after-restart behaviour looks similar to before the issue manifested.
- There’s one additional “restart” that appeared to occur just after 10pm.
- This isn’t actually a restart - merely some form of network hiccough, which affected the entire network the Pi is attached to.
Interesting. Now, I did inspect RAM usage as well, and while that isn’t shown here, the simple summary is: RAM peaked at about 50-60% usage, but was stable before and throughout the issue. Swap was completely unused during the uptime from Tuesday to Thursday.
We can conclude from this that the Pi was still performing operations, and was trying to do something (we just don’t know what) very aggressively in the background. With this, we still have no clue as to the issue, as it appears like there shouldn’t have really been one. So we’ve ruled out the Pi being overloaded and a RAM exhaustion issue; what about the network itself?
I could VPN in during the period of downtime, so I can safely say the network the Pi is attached to was working correctly - but I can also verify that the Pi was not connected to the network at the time, based on the router’s clients list.
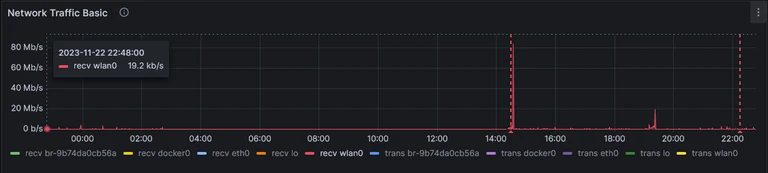

Looking at the Network Traffic graph, it’s a bit hard to see anything, since during normal operation it looks like there’s hardly any network activity anyway; the 80 Mbps spike that occurs on restart just dwarfs everything else. Let’s zoom in and look at just the period of unavialability, plus a tiny bit before that:
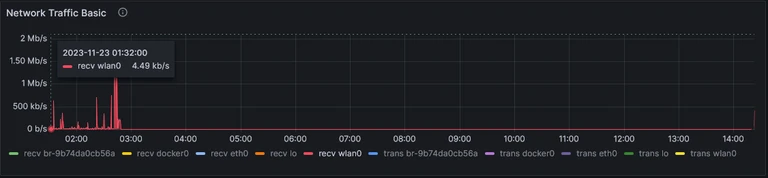

Ahah! We can clearly see now that the network usage was pretty active during the period before the downtime, but absolutely nonexistant the moment the downtime began. We can now safely say the issue was purely a networking one, localised to the Pi itself. I’m not really sure how to interpret the other graph nearby that really stood out to me, but I’ll show it nonetheless as I feel it probably explains what the pegged CPU core was doing:
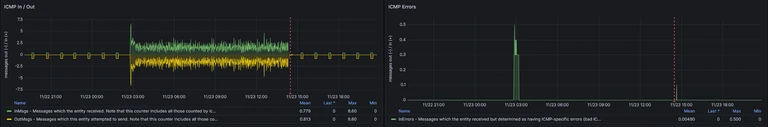

Insofar as I can tell, we had a spike in ICMP errors as the downtime began, and then the Pi went absolutely mad with ICMP requests - none of which actually manifested in the wlan0 interface’s network traffic logs. Curious.
Based on all of this, my current working hypothesis is pretty simply that the wlan0 device driver on the Pi crashed, and failed to recover. I’m unsure on if that was due to the ICMP errors, or if they were a consequence of the crash - let me know if you have better knowledge of this!
Okay, so how do we avoid having to call my dad to restart the Pi in future?
The way the Pi is connected to the network is something I might change in future - such as switching to ethernet, rather than WiFi - but in the meantime, it’s not up for debate. So, if we can’t specifically guarantee this issue won’t happen again, let’s look at mitigating it.
Strictly speaking, it already is - if my hypothesis that the kernel is still running correctly is, itself, correct, this issue would have resolved itself on Sunday, with the next scheduled automatic restart… But I really want to listen to my music before Sunday, and while I have local backups, that would mean:
- I can’t use Jellyfin’s “Instant Mix” feature, which I very much enjoy;
- My stats on Jellyfin (and Last.fm as I only scrobble through the browser and Symfonium) would be off, as they wouldn’t account for the entire time between Thursday and Sunday.
So… Relying on that would suck - especially if the Pi ever got into this state on a Monday. Surely there’s a better way?
Enter the Watchdog
Weirdly, the solution does exist and is a feature of basically every single Pi in existence? You’d think the Raspberry Pi Foundation would have documented it in their, uh, documentation - but no.
Reading through this post by Diode, we can see both how to set up the solution, and that I’m not the only one to run into this issue. That’s reassuring! Strictly speaking, the solution they provide is outdated[1], but I couldn’t see how to use the newer solution to also monitor the wlan0 interface, so… It is what it is! The watchdog would be useless for this situation if it isn’t watching the networking interface, since it appeared the kernel was still working perfectly fine.
So, I set up watchdog, which is pretty simple:
- Ensure the watchdog is available:
sudo wdctl- Should see something along the lines of:
Device: /dev/watchdog0 Identity: Broadcom BCM2835 Watchdog timer [version 0] Timeout: 15 seconds Timeleft: 14 seconds Pre-timeout: 0 seconds FLAG DESCRIPTION STATUS BOOT-STATUS KEEPALIVEPING Keep alive ping reply 1 0 MAGICCLOSE Supports magic close char 0 0 SETTIMEOUT Set timeout (in seconds) 0 0 - If not, add
dtparam=watchdog=onto/boot/config.txt, reboot, and try again. - This will not work whilst
watchdogis running, as it takes exclusive control (less -f /dev/watchdog0complains about the device or file being busy). That’s normal.
- Should see something along the lines of:
- Install watchdog as normal:
sudo apt install watchdog - Configure
/etc/watchdog.conf(presented in order of entries in the default file)watchdog-device = /dev/watchdog # maximum 15s for RasPi watchdog-timeout = 15 # time (s) to wait between checks. must be <= half of the watchdog-timeout # make sure it's low enough for the checks to run after the interval *before* the watchdog times out! interval = 1 # every `logtick` `intervals`, a syslog message is written. # if you have some spurious tests (but hopefully not any that fail for a full 15s!) this may help logtick = 5 # keep the watchdog in memory & highest priority; reduces risk of missing a watchdog timeout & rebooting realtime = yes priority = 1 # trigger the watchdog if we don't receive anything on `wlan0` for a while # you might want to ping something else, or monitor another interface # I do find that a wlan0 monitor still passes even in an ethernet-connected environment. interface = wlan0 # check that `sshd` is running! pidfile = /var/run/sshd.pid # max load in the last 1, 5, 15 min # can catch cases of full system lockup due to excessive load # (but be really certain about how many processes might run simultaneously under normal use!) max-load-1 = 24 max-load-5 = 18 max-load-15 = 12 # a Pi4 has 4 cores, so practically a load average of 4 will be maxed out. 6 is probably overloaded. # that said, I'm paranoid of interrupted compiles etc, so sticking with the suggested values is a # conservative choice. it'd catch forkbombs etc (eventually), so it's better than not having anything. - Enable and start:
sudo systemctl enable watchdog; sudo systemctl start watchdog- This might have already happened, in which case
stopandstartthe watchdogrestartdoes not work
- This might have already happened, in which case
- Check it’s running, and monitor for a brief while for any errors of potential concern…
sudo systemctl status watchdog- You should see responses that reflect the configuration you’ve set (eg, “watchdog now set to 15 seconds”).
- If you see
alive=[none]rather thanalive=/dev/watchdog, and you don’t see a hardware watchdog identity (“Broadcom BCM2835 Watchdog Timer”), then it’s not working correctly; check your/etc/watchdog.confand then stop and start the Watchdog service again.
- Once everything looks alright, you’re done!
- The hardware watchdog should trip if
wlan0doesn’t receive anything for a bit, the kernel hangs, or the 1m load average exceeds 24. - If it trips, it’ll trigger a reboot of the Pi, getting everything back to a nice functioning state!
- The hardware watchdog should trip if